

During Codemotion‘s Workshop Fest that took place last March, our colleagues Simone Esposito and Simone Ripamonti had the chance to give a talk about Open Telemetry, one of the open source projects recognised by the Cloud Native Computing Foundation.
We began with a theoretical overview, followed by a hands-on workshop in which we demonstrated how to use Open Telemetry to provide centralized observability in a Kubernetes-based system on which a number of apps written using various technologies were deployed.
What is “observability”?
Observability is the ability to understand a system’s internal state through its outputs. External outputs in software are telemetry signals, which can be classified into three categories: traces, metrics, and logs. To observe a system, the software must be instrumented to provide telemetry data that may be ‘observed’.
Why observe?
Observability is relevant because it allows you to:
- Identify problems: Observability helps developers detect potential issues by providing insight into the system’s activity. It is very beneficial for detecting bugs because it allows the problem to be identified through log analysis.
- Analyzing performance allows you to understand how the system responds to requests and evaluate its performance.
- Security analysis: security is a top priority, and active monitoring allows you to identify certain patterns of use that can detect potential security issues.
- Planning resources: observability allows for the forecasting of demand and the proper allocation of resources, as well as the timely scaling up or down of resources.
- Trend detection entails identifying patterns and common trends that can be used to characterize the system’s evolution.
- Continuous feedback: gives ongoing feedback on what users are utilizing.
- Alerting: observability lets you discover specific warning signals based on common criteria.
- KPIs / SLAs: Objective measurements allow for accurate assessments of KPIs and SLAs.
What is Open Telemetry
Open Telemetry is a framework for managing telemetry data, including signal generation, collection, management, and export. It differs from an Observability Backend due to the fact it isn’t focused on storage and display.
It is based on two principles.
- Vendor neutral since the data belongs to the application developer. This strategy prevents vendor lock-in, giving the user complete control over their data and the ability to utilize alternative tools.
- Drop in: its use is eased by establishing a distinct set of APIs for interacting with the framework itself. Open Telemetry defines a standard specification and protocol for telemetry and models, offers SDKs that allow for integration with different languages, provides automatic instrumentation, a collector that acts as a collector of metrics and interfaces with back-end services for observability, and a number of other useful ones depending on the type of system and how the system is deployed.
Telemetry data
There are 3 types of telemetry data: Logs, Metrics and Traces.
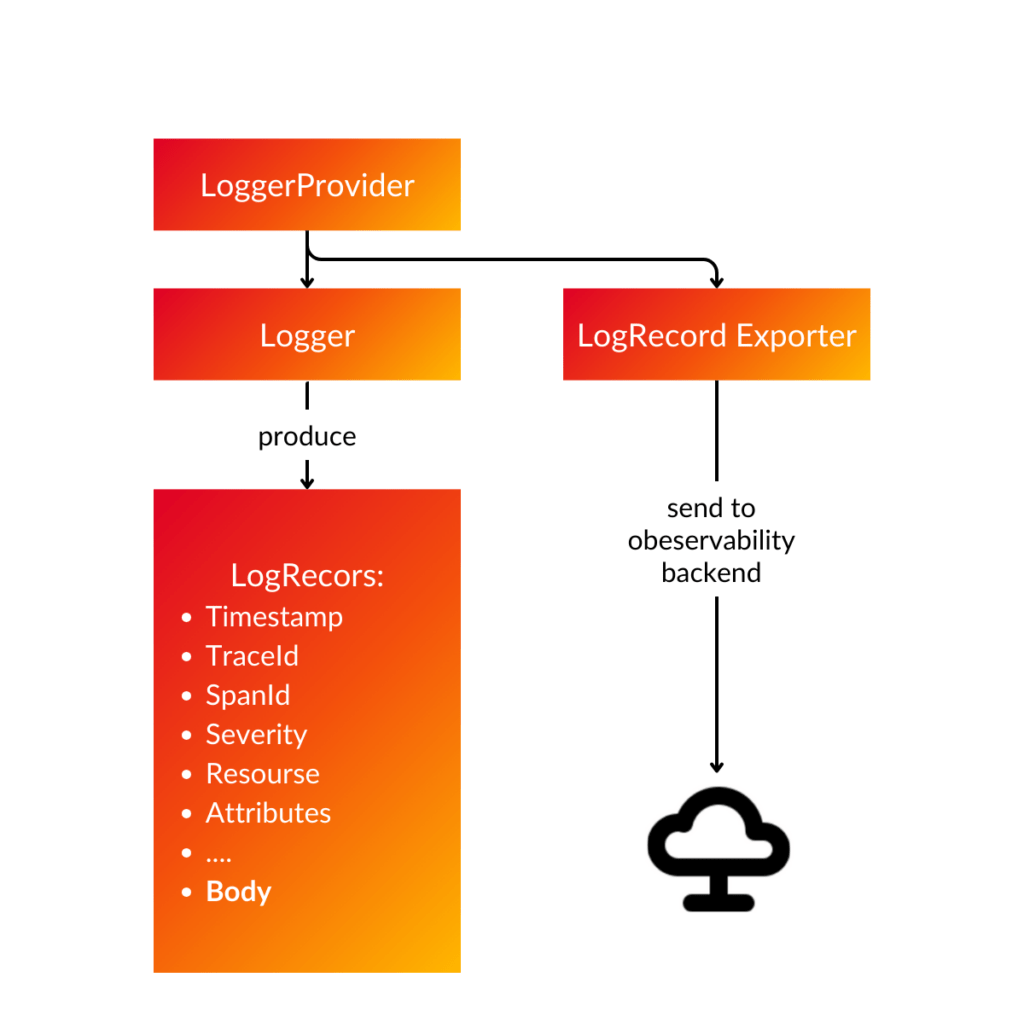
Logs: can be regarded as the most ‘legacy’ data because most modern languages provide log management. A log is a text record with a timestamp. It can be structured or unstructured, and the latter is more difficult to control. Open telemetry presents a link between Logs and Traces/Metrics, making it possible to enhance the traditional Log with metadata that simplifies the correlation.
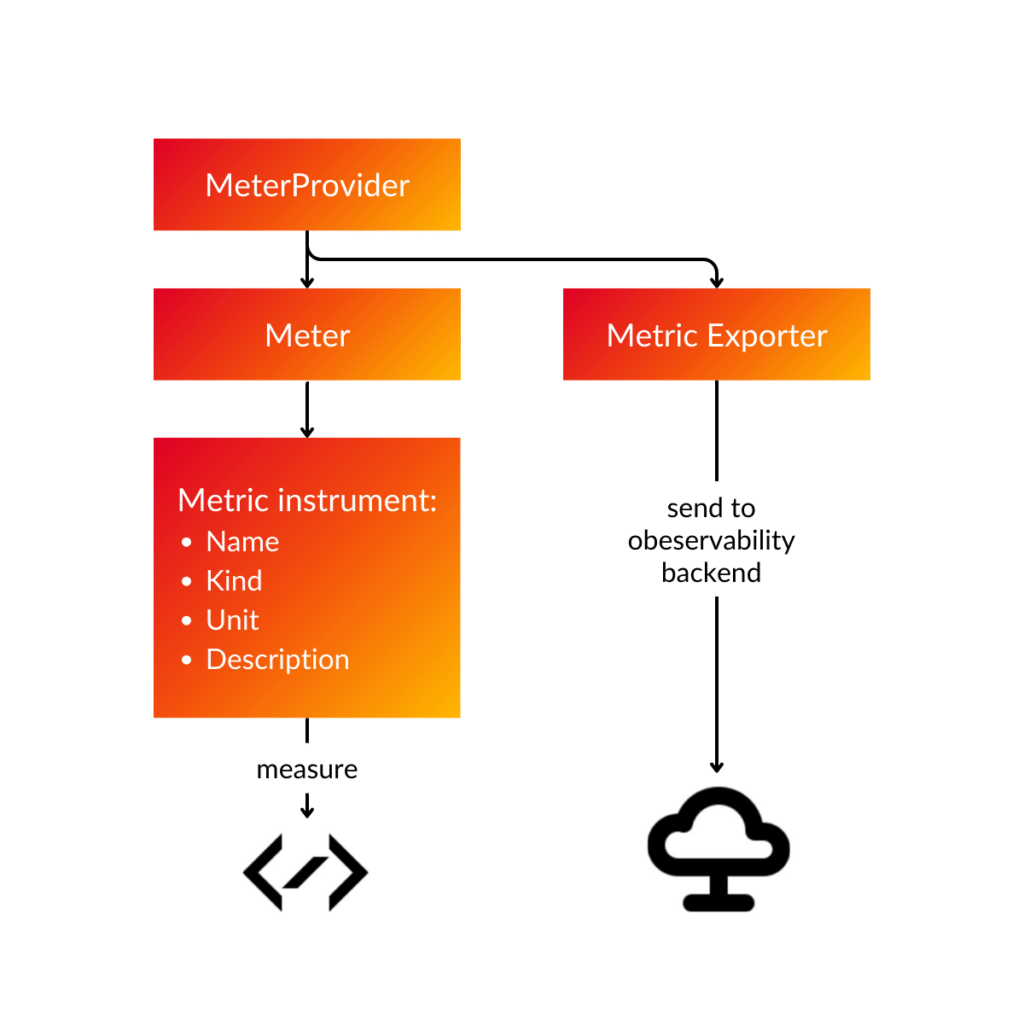
Metrics are runtime measurements of a service that are identified by the measurement’s value, timestamp, and metadata. The data gathered is frequently used for alerts and decision making.
Open Telemetry provides the following metrics:
- Counter: monotonic growing values (for example, the total HTTP requests received by the application).
- Updown counter: growing and falling monotonic quantities, such as the amount of messages in a queue.
- Gauge: represents an around-time value of the application (for example, CPU utilization at a specific time).
- Histograms are more complicated metrics that are commonly employed in statistical reasoning (for example, evaluating request latency).
- Aggregation metrics are derived from numerous values and measures that are aggregated with respect to a certain time window.
Traces
They give what happens within the system after a request by allowing the request flow within the application to be traced. They’re available for both monolithic and distributed systems.
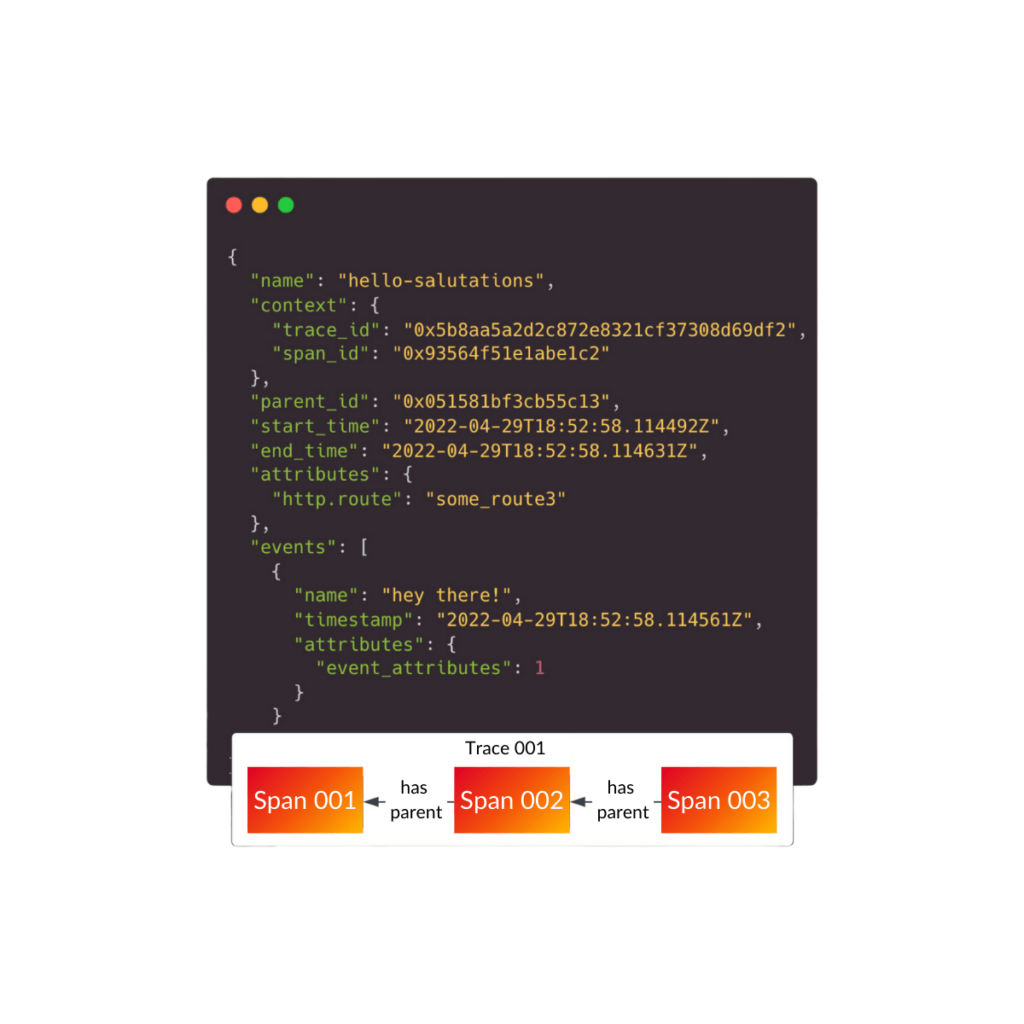
Typically, traces consist of:
- Name
- Context: SpanID and TraceID (Parent SpanID)
- KV characteristics
- Events are log messages within a trace that provide timely information about what occurred at a specific period within that trace.
They differ from Spans since these refer to operations with a beginning, a progress, and a finish, whereas Events are punctual events that occur within a specific Span. To further grasp the distinction, a span is the loading of a web page considered as the full process, whereas an event is the moment.
What is instrumentation
As previously said, instrumentation is essential to monitor a system by generating and recording telemetric information and data.
There are two instrumentation modes that can be used together:
- Code Based: Open Telemetry defines a set of APIs and SDKs for the various supported languages to define telemetry signals using code. This method ensures a high level of control over what is emitted, but it is more onerous and demanding, and it also results in a loss of transparency in the application code, which is ‘altered’.
- Zero Code: In this method, no code is updated; instead, language-dependent automatic service instrumentation mechanisms are employed. For example, byte code manipulation.
What is Centralized Observability
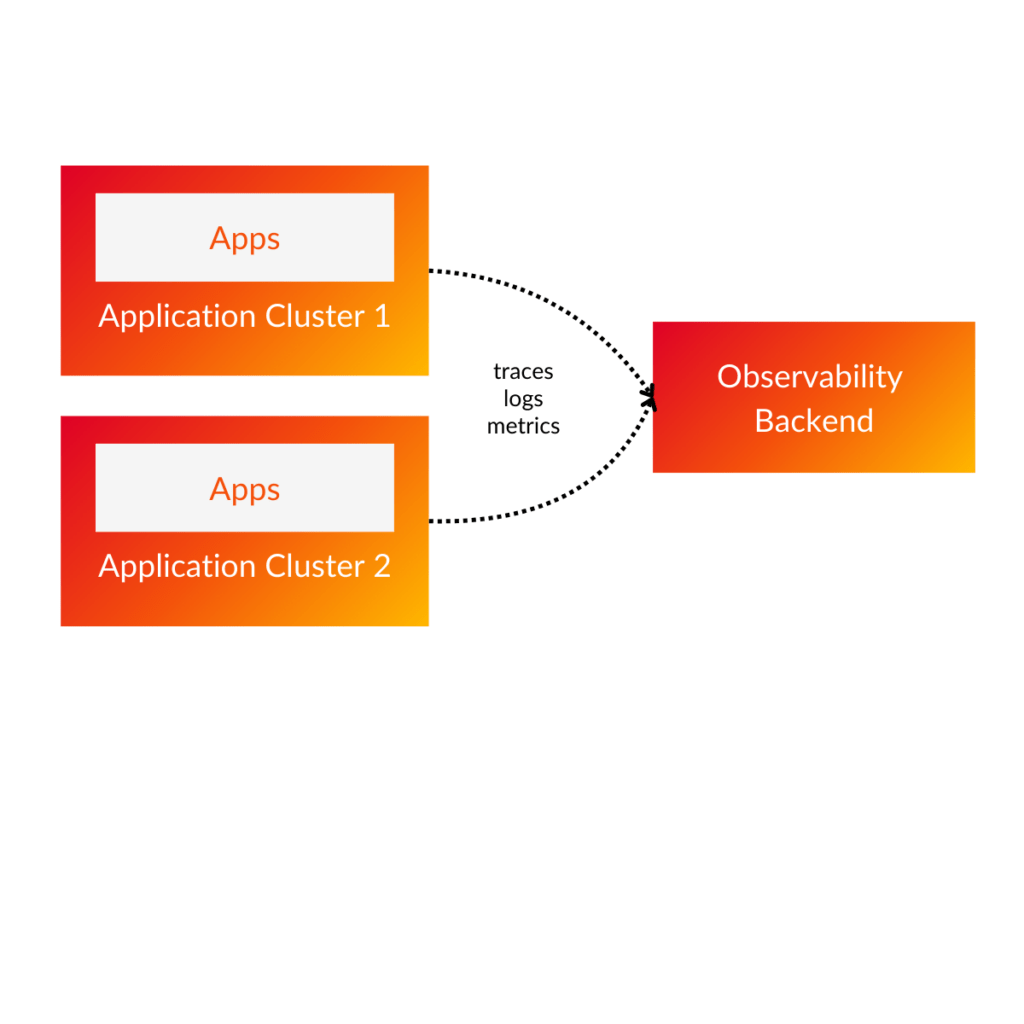
Centralized observability means that our apps on some of our clusters concentrate observability into a single location.
It has numerous benefits.
- Ease of management and use: the aggregation of all telemetry in a single management ensures easier maintenance and makes the data more usable.
- Increased uniformity through the adoption of similar observability standards and policies.
- Resource savings
- Improved and strengthened security controls
- Increased availability
To listen to the whole talk and practical workshop, visit the dedicated page.
Main Authors: Simone Esposito Software Engineer Team Leader and Simone Ripamonti DevOps Engineer Team Leader @ Bitrock