

The Problem
The popularity of microservice architecture has enormously increased recently; but this comes with new challenges.
One of these is monitoring. In one of our projects, we used a Kafka connector to intercept changes in our database and write data to a topic. This was a very important component of the system, so we needed to consider its health status carefully.
Solution
In our first version, we created a Kubernetes’ CronnJob with a simple shell script that checks the status of the connector and, eventually, deletes the failed and restarts it.
This worked quite well; however, this is different from how the other services are health checked with the Kubernetes.
The connector was deployed with Kubernetes; the most natural thing to do is thus using k8s for monitoring pods and eventually restarting it.
The Kafka Connect framework comes with Rest API, and one of these gives you the state of the connectors:
i.e : https://bitrock.it/wp-content/blog/monitoring-kafka-connector-with-kubernetes/
This seems to resolve our problem… But is it really the case?
Kubernetes health check controls the HTTP status code; the problem is that the Kafka connector API returns 200 HTTP status.
For instance, if the task is failed, the API will return:
HTTP/1.1 200 OK
{“state”:”FAILED”,”id”:1,”worker_id”:”192.168.86.101:8083″}
In this case, from the Kubernetes point of view, everything is ok.
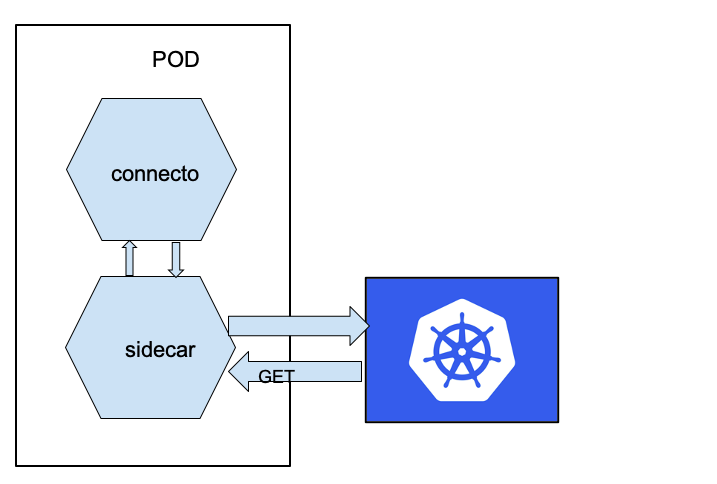
The solution that worked well for us consisted in adding a sidecar container that takes responsibility for exposing the state of the connector task.
The sidecar pattern allows you to extract some functionalities of your application in a different component. For example, we can separate the authentication layer from our “main” component that contains the business logic or – as in our case – extracts the monitoring part.
Our goal is to obtain something like this:
First of all, we created a simple application that takes care of calling the connector API and exposes an API for Kubernetes (we used a simple Python application using Flask – but you can use whatever you want). Something like this:
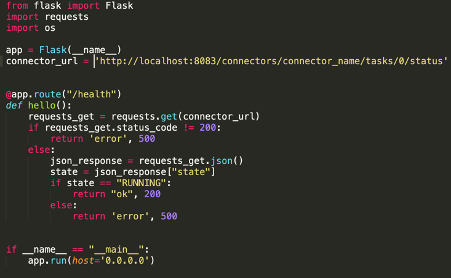
As you can see, the code is very simple.
The application does two different things: first of all, it exposes an endpoint at “/health” paths that will be called periodically by Kubernetes; secondly, it checks the status of a task and eventually returns an Internal Server Error, in case the HTTP status of the connector was not 200 or if the status was not “RUNNING”.
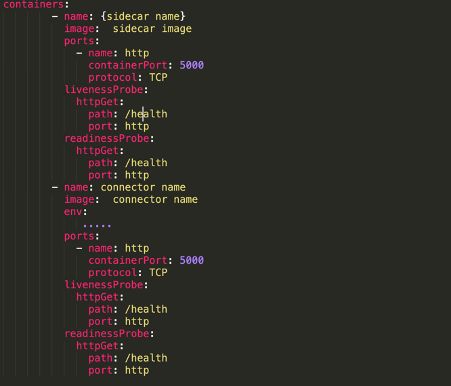
Now, this application needs to be deployed in the same pods of the connector. This can be done by adding to our deployment.yaml file the container that contains our Python application:
Conclusions
The logical result?
Both containers expose the health check of the sidecar, since Kubernetes does not restart the entire pods if one container is up; exposing the same API, the destiny of both containers would be the same.
Once the connector is in FAILED state, Kubernetes will restart the pod.
Some cloud providers may provide a built-in solution for problems like this; but if you can’t use it – for whatever reason – this can be a possible solution.
Author: Marco Tosini, Principal Engineer @Bitrock