What is Prometheus?
Prometheus is an open-source systems monitoring and alerting toolkit written in Go. Released by SoundCloud in 2012, it joined Cloud Native Computing Foundation in 2016 and in 2018 became the second graduated project alongside Kubernetes.
Based on metrics and not on logs, Prometheus uses its own time series database called TSDB and its own query language (PromQL).
The CNCF community loves Prometheus because:
- it’s easy to configure, deploy, and maintain
- it’s designed in multiple services, aiming at modularity
- it’s container ready, “docker run” is enough to have it started
- it’s orchestrator ready, supporting dynamic configurations
- it’s an ecosystem: many client libraries and exporters maintained both by Prometheus team and the community

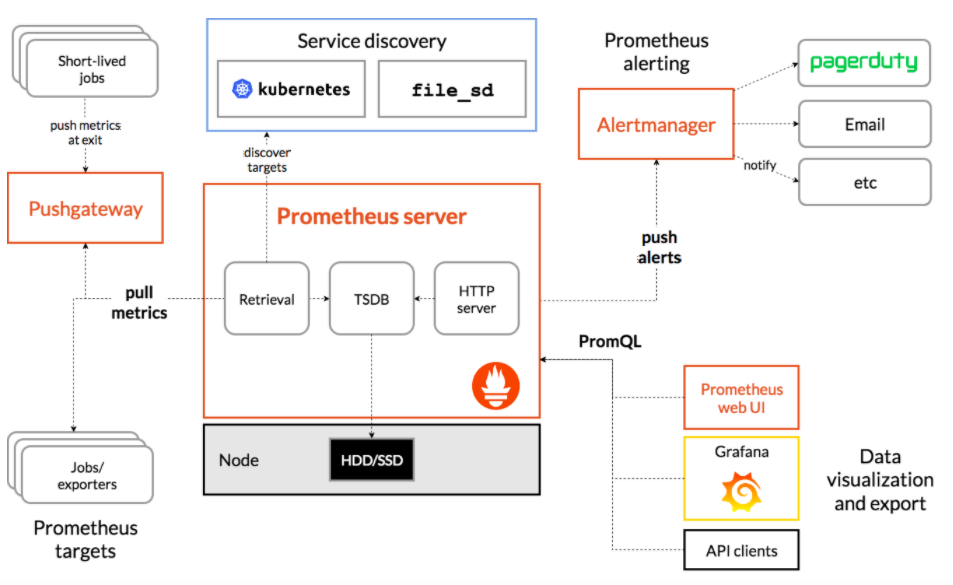
- Prometheus collects data
- Exporters expose data
- Applications expose data
- Grafana displays data
- Alertmanager dispatches alerts
Prometheus is a pull-based monitoring system that scrapes metrics from configured endpoints, stores them efficiently and supports a powerful query language to compose dynamic information from a variety of otherwise unrelated data points.
To monitor your services using Prometheus, your services need to expose a Prometheus endpoint. This endpoint is an HTTP interface that exposes a list of metrics and the respective current values. Prometheus has a wide range of service discovery options to find your services and start collecting metrics data. The Prometheus server continuously polls the metrics interface on your services and stores the data. This provides a standardized way for metrics gathering.
Prometheus is designed to fetch data in intervals measured in seconds. And while Prometheus 2.x can handle somewhere north of ten millions series over a time window, which is rather generous, some unwise label choices can eat that surprisingly quickly.
Every 2 hours Prometheus compacts the data that has been buffered up in memory onto blocks on disk.
To reduce disk footprint, TSDB can have a shorter metrics retention period of the metrics or it can be configured to have a disk space limit. The data can be compacted and the WAL compressed as well.
The data structure is self-sufficient and can be moved from one instance to another independently given each time series is atomic and uniquely identified by its metric name (1). In recent Prometheus versions, remote storage support has been introduced in order to provide long term storage.
Core Prometheus server is a single binary and each Prometheus server is an independent process with its own storage. One of the downsides of this core implementation is the lack of clustering or backfilling “missing” data when a scrape fails.

Prometheus is not supposed to only be used with standard exporters (2), you can instrument your own code to capture the metrics that matter to you, business ones for example. Prometheus comes with the support for a wide range of languages (Go, Java or Scala, Python, Ruby, etc). Many upstream libraries are already instrumented by the maintainers, so you will get that for free!
What is a metric?
A metric is any numeric value that tells you something about how your system is operating. For example:
- How much memory it is using
- How long the last operation took* How many request were served today

In Prometheus there are 4 types of metrics: counter, gauge, histogram and summary.
A counter is a cumulative metric that represents a single monotonically increasing counter whose value can only increase or be reset to zero on restart. For example, you can use a counter to represent the number of requests served, tasks completed, or errors.
A gauge is a metric that represents a single numerical value that can arbitrarily go up and down. Gauges are typically used for measured values like temperatures or current memory usage, but also “counts” that can go up and down, like the number of concurrent requests.
A histogram samples observations, for example request durations or response sizes, and counts them in configurable buckets. It also provides a sum of all observed values. A histogram with a base metric name of exposes multiple time series during a scrape:
- cumulative counters for the observation buckets, exposed as _bucket{le=””}
- the total sum of all observed values, exposed as _sum
- the count of events that have been observed, exposed as _count (identical to _bucket{le=”+Inf”} above)
Similar to a histogram, a summary samples observations, for example request durations and response sizes. While it also provides a total count of observations and a sum of all observed values, it calculates configurable quantiles over a sliding time window.
A summary with a base metric name of exposes multiple time series during a scrape:
- streaming φ-quantiles (0 ≤ φ ≤ 1) of observed events, exposed as {quantile=”<φ>”}
- the total sum of all observed values, exposed as _sum
- the count of events that have been observed, exposed as _count
The essential difference between summaries and histograms is that summaries calculate streaming φ-quantiles on the client side and expose them directly, while histograms expose bucketed observation counts and the calculation of quantiles from the buckets of a histogram happens on the server side using the histogram_quantile() function.
https://prometheus.io/docs/concepts/metric_types/
https://prometheus.io/docs/practices/histograms/
Understanding metrics
Prometheus metrics have a name and might have any arbitrary number of labels:

A Metric has metadata (labels) and lots of functions to filter, change, remove those while fetching them from the targets. The name “node_cpu_seconds_total” consist of a prefix for the namespace (node metrics) and suffix for the unit of the value ( Seconds of CPU time in total )
https://prometheus.io/docs/practices/naming/
promtool allows to lint them for consistency and correctness.
Examples:

PromQL
Prometheus Query Language (PromQL) supports a wide range of functions for interacting with scraped metrics. Some examples:
- Filtering by label: _http_requeststotal{status=\~”5..”}
- Calculating rates: _rate(http_requeststotal[5m])
- Arithmetic ( +, *, /, -, %, ^) and Comparison ( >, <, >=, <=, ==, != ) operations
- Aggregation and Grouping: _sum(rate(node_network_receive_bytestotal[5m])) by (instance)* Quantile: _histogram_quantile(0.95, sum(rate(http_request_duration_secondsbucket[5m])) by (le))
- Recording Rule: precompute frequently needed or computationally expensive expressions, in order to make recurring queries much faster to compute
Alerting
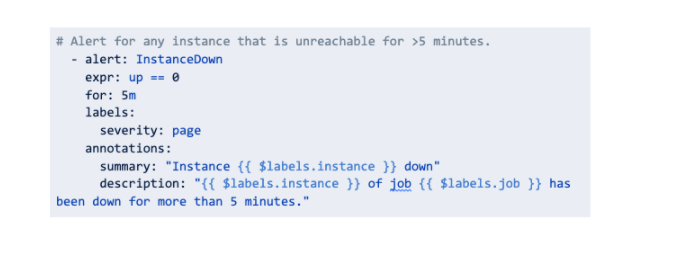
Our motto is: if you can graph it, you can alert on it! It’s really easy to set up alerts in Prometheus, it’s just a matter of defining which query to evaluate and which is the range of safe values:

Prometheus will evaluate the alerting rule regularly and will mark it as firing in case the rule matches. However, Prometheus core component will not take care directly of sending alerts to final users. Alertmanager instead will take care of performing alert related operations.
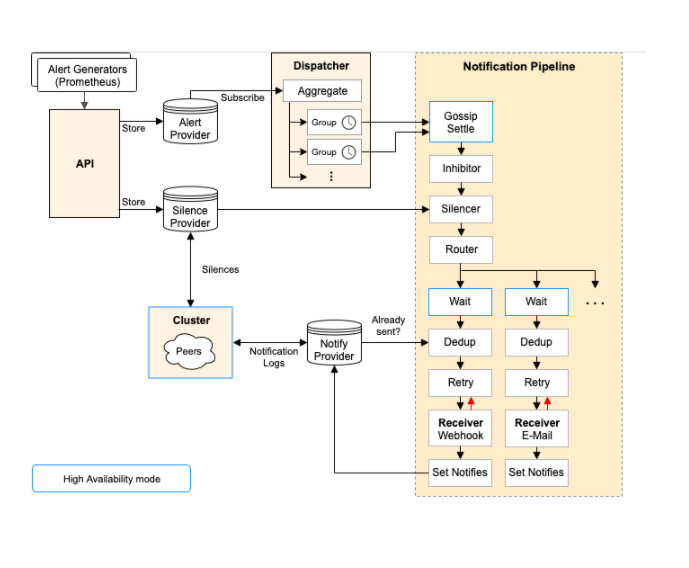
Alertmanager :
- Receives alerts from Prometheus
- Groups them
- Inhibits them, for example in case of false positives
- Dispatches them to downstream services, such as Slack or PagerDuty and many more
- Built In HA leveraging gossip protocol

References
- Official Project Documentation https://prometheus.io/docs/
- A blog on monitoring, scale and operational Sanity https://www.robustperception.io/blog
- https://github.com/prometheus/alertmanager#high-availability
Notes
(2) [https://prometheus.io/docs/instrumenting/exporters]
https://github.com/prometheus/prometheus/wiki/default-port-allocations
Author: Matteo Gazzetta, DevOps Engineer @Bitrock

